X-Ray Diffraction Characterization
|
The following are observations on how the results of a Philips PANalytical X’Pert X-Ray Diffractometer (XRD) change based on the set up.
-Divergence Slit and Brass Mask Effects -Receiving Slit Width Effects & Instrument Broadening -Sample Height Offset Effects |
Divergence Slit and Brass Mask Effects
When the divergence slit is smaller there is a drastic cut to the number of x-rays that strike the sample but the peak location stays the same.
Changing the divergence slits controls the length of the x-ray beam on the sample and changing the brass mask controls the axial width of the beam.
The choice of divergence slit size depends on the sample size and starting scan angle while the choice of brass mask is to limit the beam to only have contact with the sample.
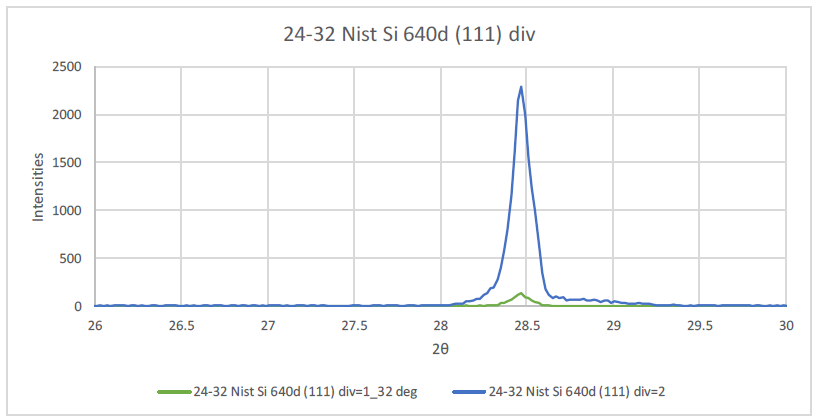
The graph above shows scans were done of the (111) NIST Si standard, with the anti-scatter slit held constant at an 1/8 and the receiving slit at a 1/16 while differing the divergence slit size.
When comparing the largest divergence slit (2) scan to the smallest (1/32) scan the peak location is the same, but the shape differs.
These scans would conclude that the divergence slits limit the number of x-rays allowed to hit the sample as the slit size decreases.
The choice of divergence slit size depends on the sample size and starting scan angle while the choice of brass mask is to limit the beam to only have contact with the sample.
The graph above shows scans were done of the (111) NIST Si standard, with the anti-scatter slit held constant at an 1/8 and the receiving slit at a 1/16 while differing the divergence slit size.
When comparing the largest divergence slit (2) scan to the smallest (1/32) scan the peak location is the same, but the shape differs.
These scans would conclude that the divergence slits limit the number of x-rays allowed to hit the sample as the slit size decreases.
Receiving Slit Width Effects & Instrument Broadening
The final observed peak width is determined from a mixture of the sample’s intrinsic XRD peak width and the instrument broadening, which is dominated by the receiving slit’s width.
These scans show a few degrees across the (004) peak from the Si standard varying the receiving slit in the series 1/2o, 1/4o, 1/8o, 1/16o, 1/32o. Keeping the divergence slit at a constant (1/2o) and simultaneously changing the anti-scatter slit to keep it one size larger.
These scans show a few degrees across the (004) peak from the Si standard varying the receiving slit in the series 1/2o, 1/4o, 1/8o, 1/16o, 1/32o. Keeping the divergence slit at a constant (1/2o) and simultaneously changing the anti-scatter slit to keep it one size larger.
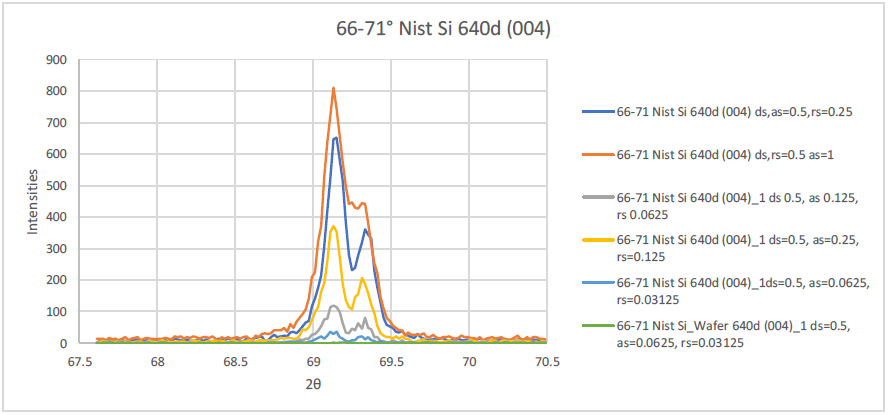
As the receiving slit becomes smaller, so does the signal. Also, as the receiving slit decreases the peak gains definition.
|
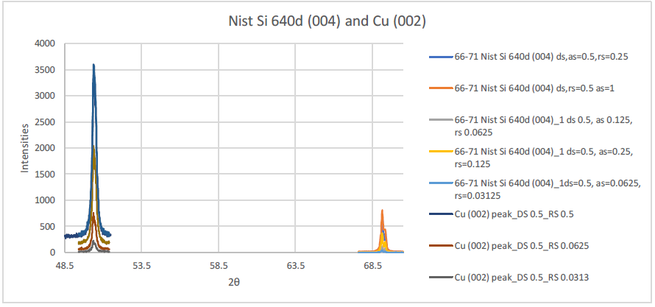
Cu powder produced by filing, or some other cold worked metal sample. is expected to show a large broadening caused by micro-strain and finite particle size.
As seen, the Cu peak is effected more by changing the receiving slits than the Si 640d (004) |
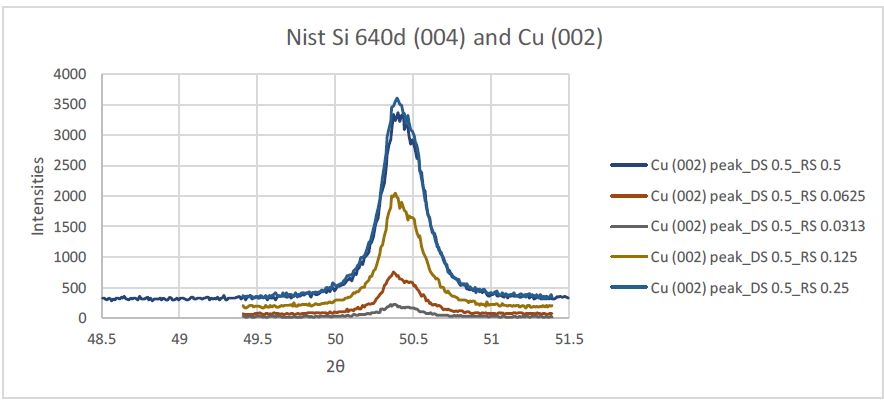
The Cu peak widens as the receiving slit becomes larger
Sample Height Offset Effects
The graph below shows the diffraction patterns of a sample of NIST Si 640d (111) recorded multiple times while the height of the sample was changed. Both having the sample be taller and shorter than the optimal height resulted in a loss of signal. The taller sample height experienced the most loss of signal. This could be because the alignment of the detector would not match the trajectory of the diffracted rays.
Both height differences experienced the peak shifting to a different angle location. The lower sample shifted to a degree lower than the optimal height, while the higher sample shifted to a degree that is higher than the optimal.
Both height differences experienced the peak shifting to a different angle location. The lower sample shifted to a degree lower than the optimal height, while the higher sample shifted to a degree that is higher than the optimal.
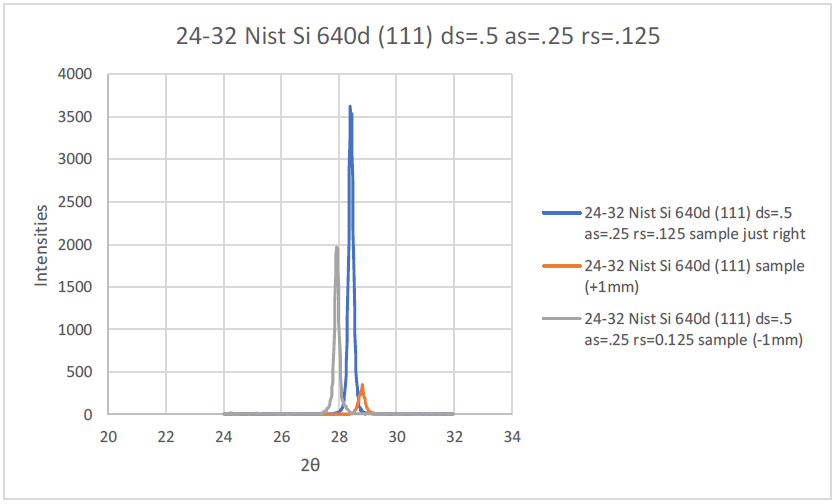
The height of the sample effected the amount of signal, the higher sample having the most signal lost, and the placement of the peaks
